Cyber Situation Report
You want to perform an analysis on all vulnerable systems in a specific sector, e.g. healthcare?
We conduct global scans for you and create a detailed cyber situation report. Our data and analysis will help you to ensure that you have the best possible protection for your cyber infrastructure.
- With the help of our Cyber OSINT platform, you can generate global cyber situation reports tailored to a specific threat.
- We use different visualization options including the creation of maps or the illustration of international endemic trends of a new type of vulnerability over multiple points in time.
- Together, we customize our Cyber OSINT platform to your needs and develop automated dashboards and alerts.
Cyber Situation Report
Vulnerable Citrix / NetScaler Server
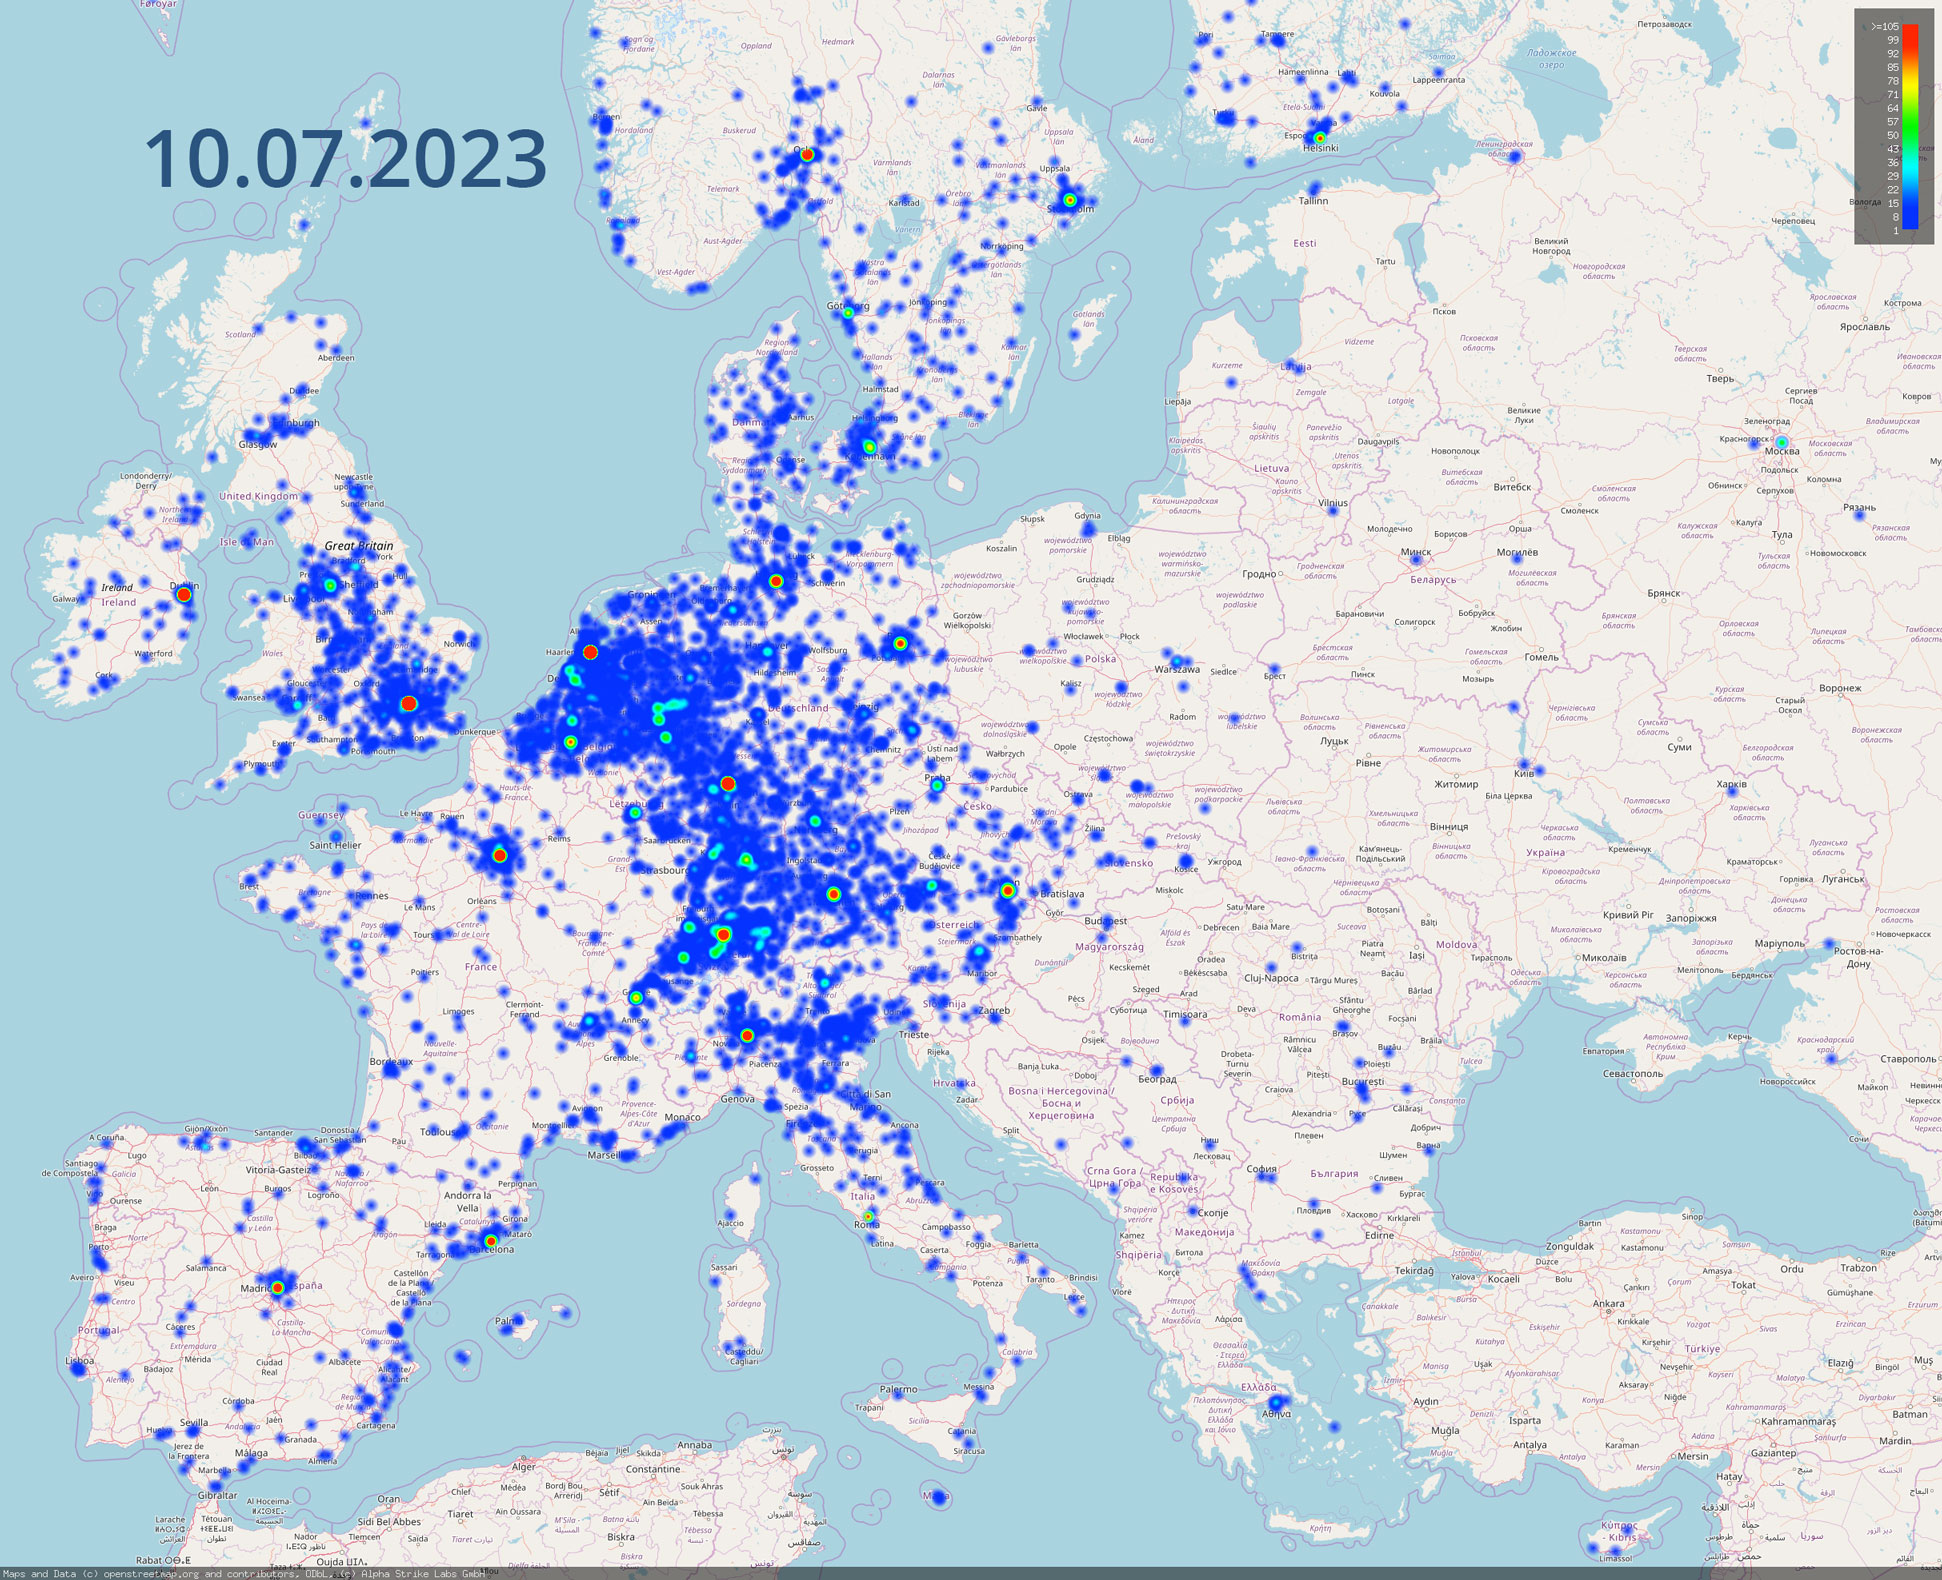
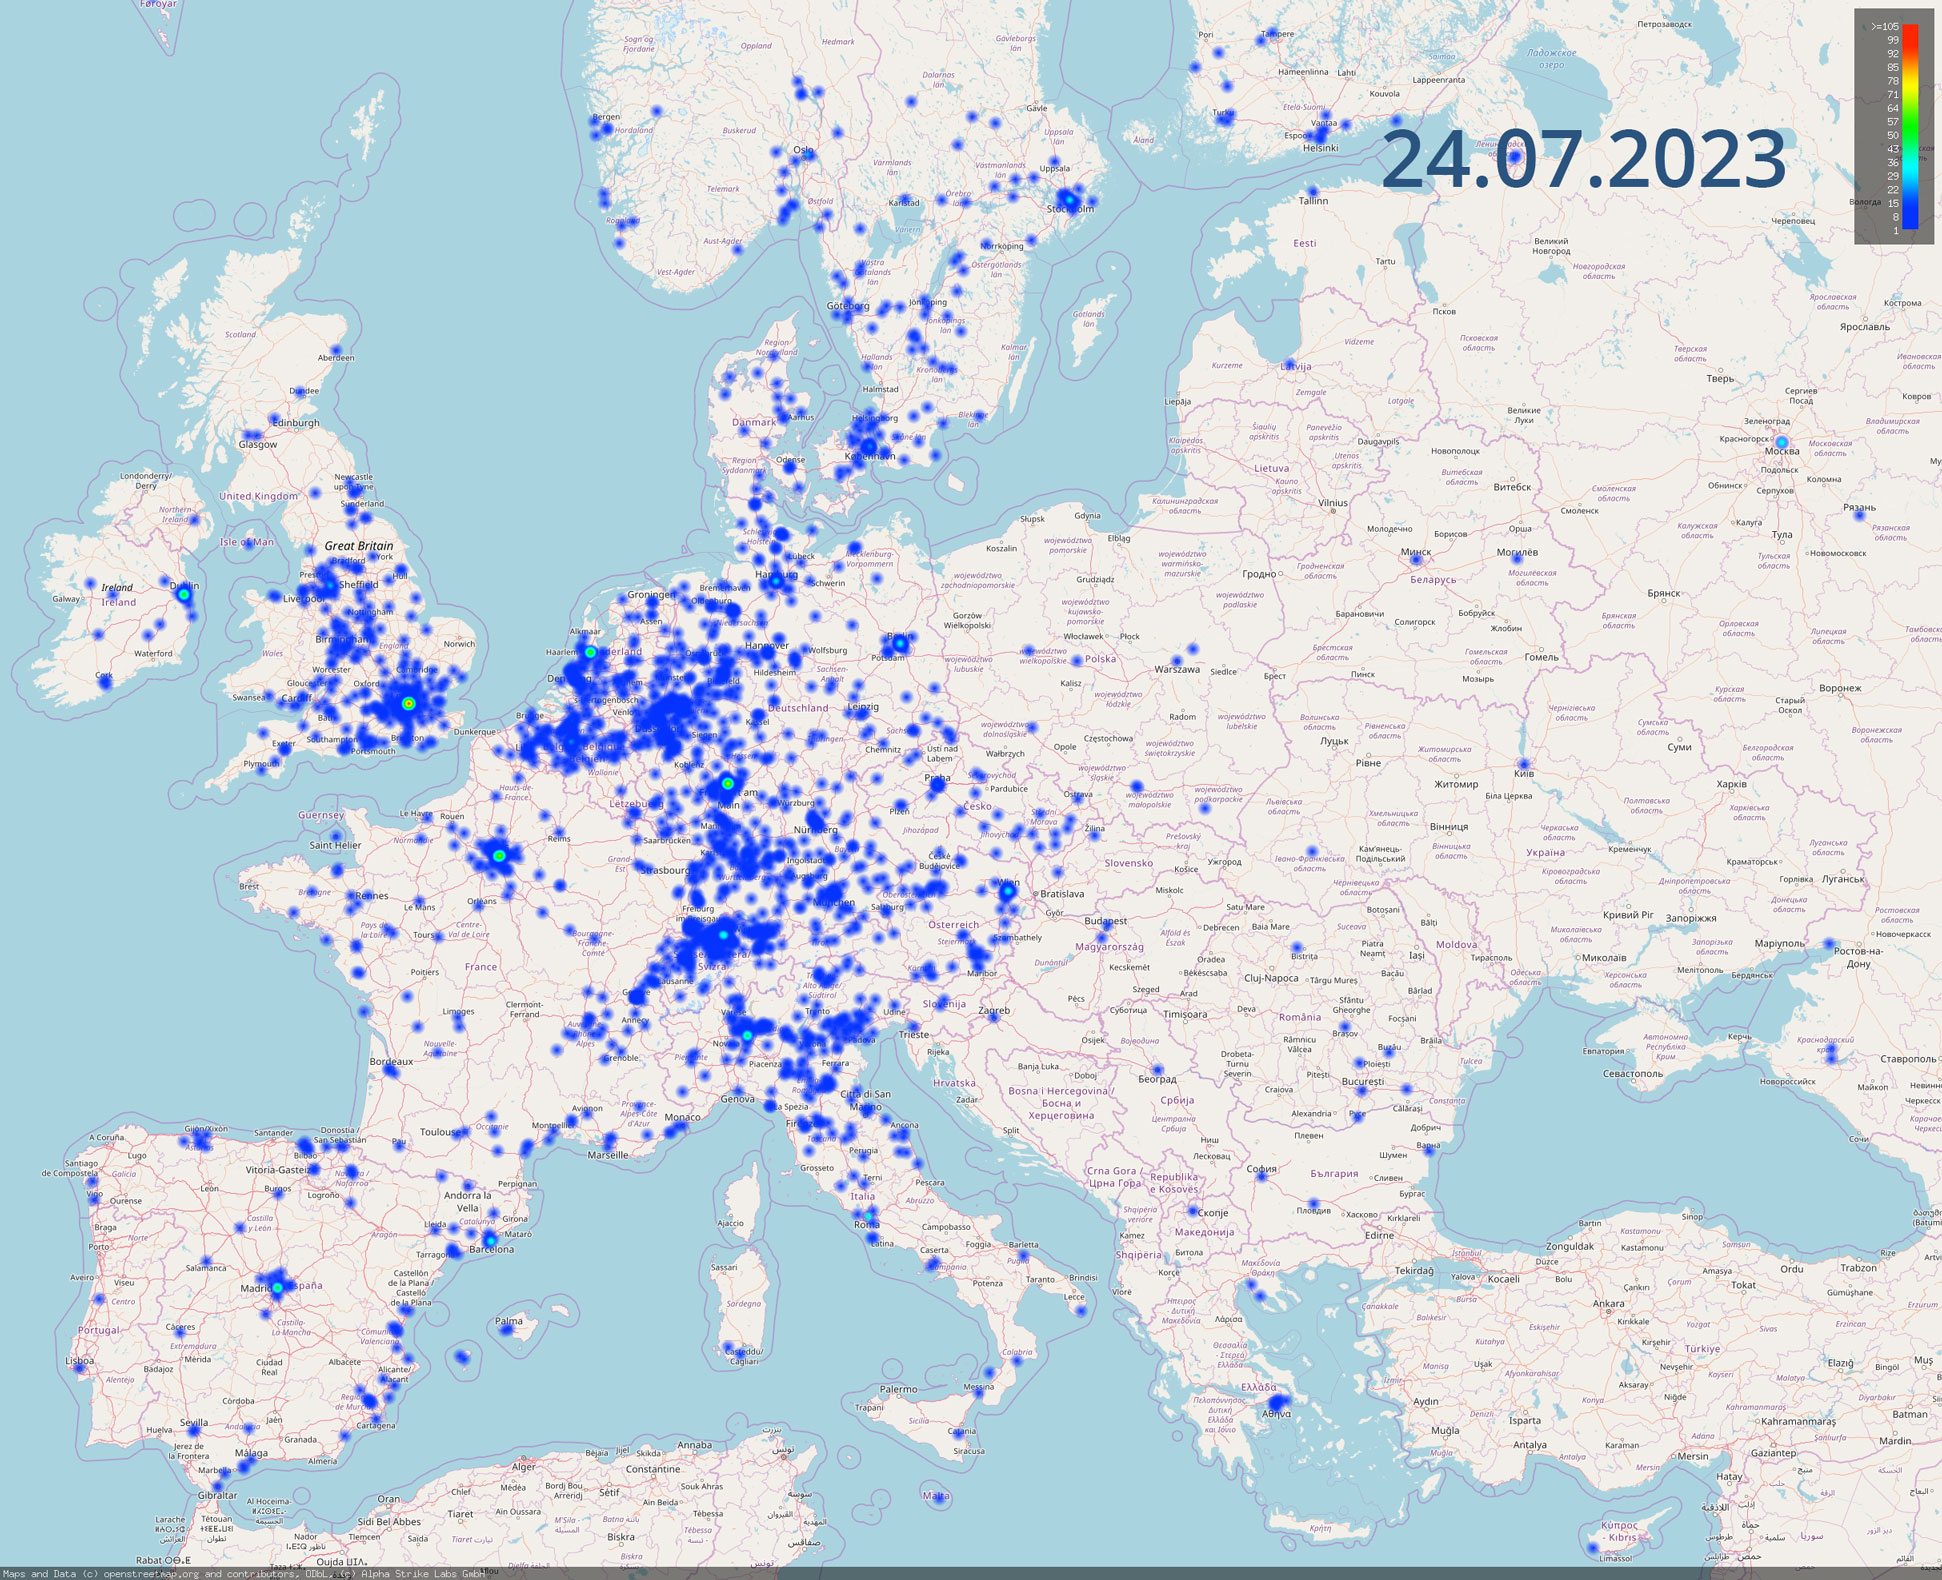
The side-by-side comparison of the two heatmaps shows how the data we generate can be used for cyber situation reports. We used recurrent scans to visualize the development of the number of vulnerable servers for the Citrix / NetScaler vulnerability CVE-2023-24488 published in July 2023. The heatmaps illustrate the difference in scans from July 10th, 2023 to July 24th 2023 and the associated positive trend nicely.
The vulnerability in Citrix ADC and Citrix Gateway allows an attacker to perform cross site scripting. Reflective Cross-Site Scripting (RXSS) can be used for cookie-stealing or redirecting, which only requires a user to click a link for a genuine legitimate domain.
Germany has the third fastest patching rate
We scanned for CVE-2023-24488 on Monday, 10th of July 2023 and identified 54,064 Citrix/Netscaler systems in use. 30,659 of those systems were vulnerable. After 14 days lots of systems did get patched, but 36% were still vulnerable.
- The Netherlands and Switzerland reacted fast and patched the most servers.
- Germany did a great job patching more than two thirds of all vulneralbe servers in 14 days.
- China patched only one quarter of all vulnerable servers
| Country | Vulnerable Systems on 2023-07-10 | Vulnerable Systems on 2023-07-24 | Patched Systems |
|---|---|---|---|
| Netherlands | 1,160 | 215 | 80% |
| Switzerland | 1,333 | 362 | 73% |
| Germany | 4,185 | 1,263 | 70% |
| Australia | 1,116 | 390 | 65% |
| United Kingdom | 1,976 | 874 | 56% |
| Canada | 754 | 345 | 54% |
| France | 823 | 396 | 52% |
| United States | 9,616 | 4,929 | 49% |
| Italy | 718 | 413 | 42% |
| China | 847 | 636 | 25% |
Log4shell Cyber Situation Report
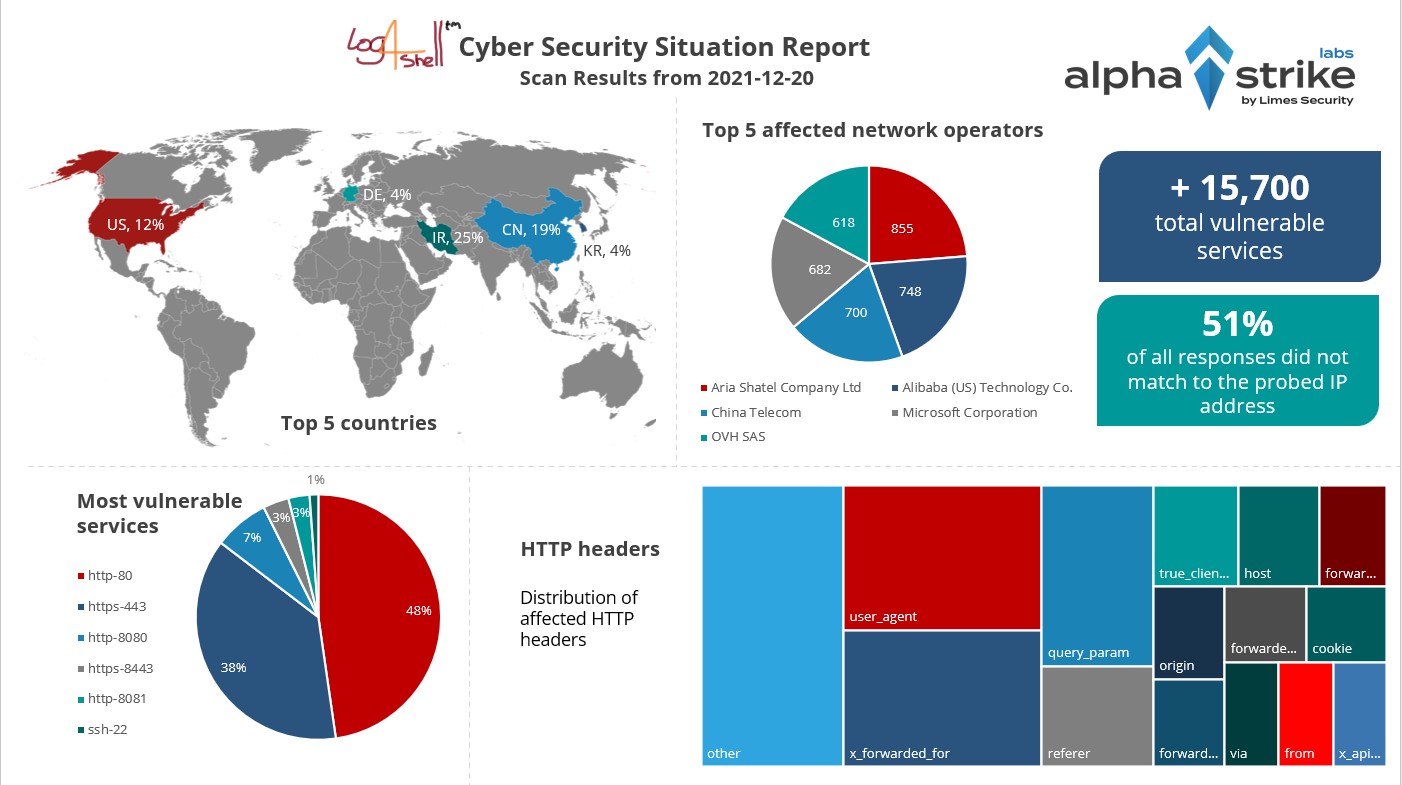
When the Log4Shell (CVE-2021-44228) vulnerability was published, we conducted several scans to analyze the affected servers and provided our data to National CSIRTs. We looked at the most affected countries, analyzed the most affected network operators and vulnerable services.
Our scan data was also included in the Shadowserver Special Report about Vulnerable Log4j Servers.
Cyber Radar - Keep everything on the radar with interactive dashboards


Cyber Radar helps you identify fundamental correlations of service distributions on the Internet. The scan results can be interactively grouped and analyzed by countries, Autonomous Systems (AS), IP prefixes or other domains.
This enables you to quickly identify new vulnerabilities or potentially vulnerable services spreading across your national cyber infrastructures. Interactive dashboards help you keep track of your critical infrastructures as a national CERT.
More info about Cyber Radar
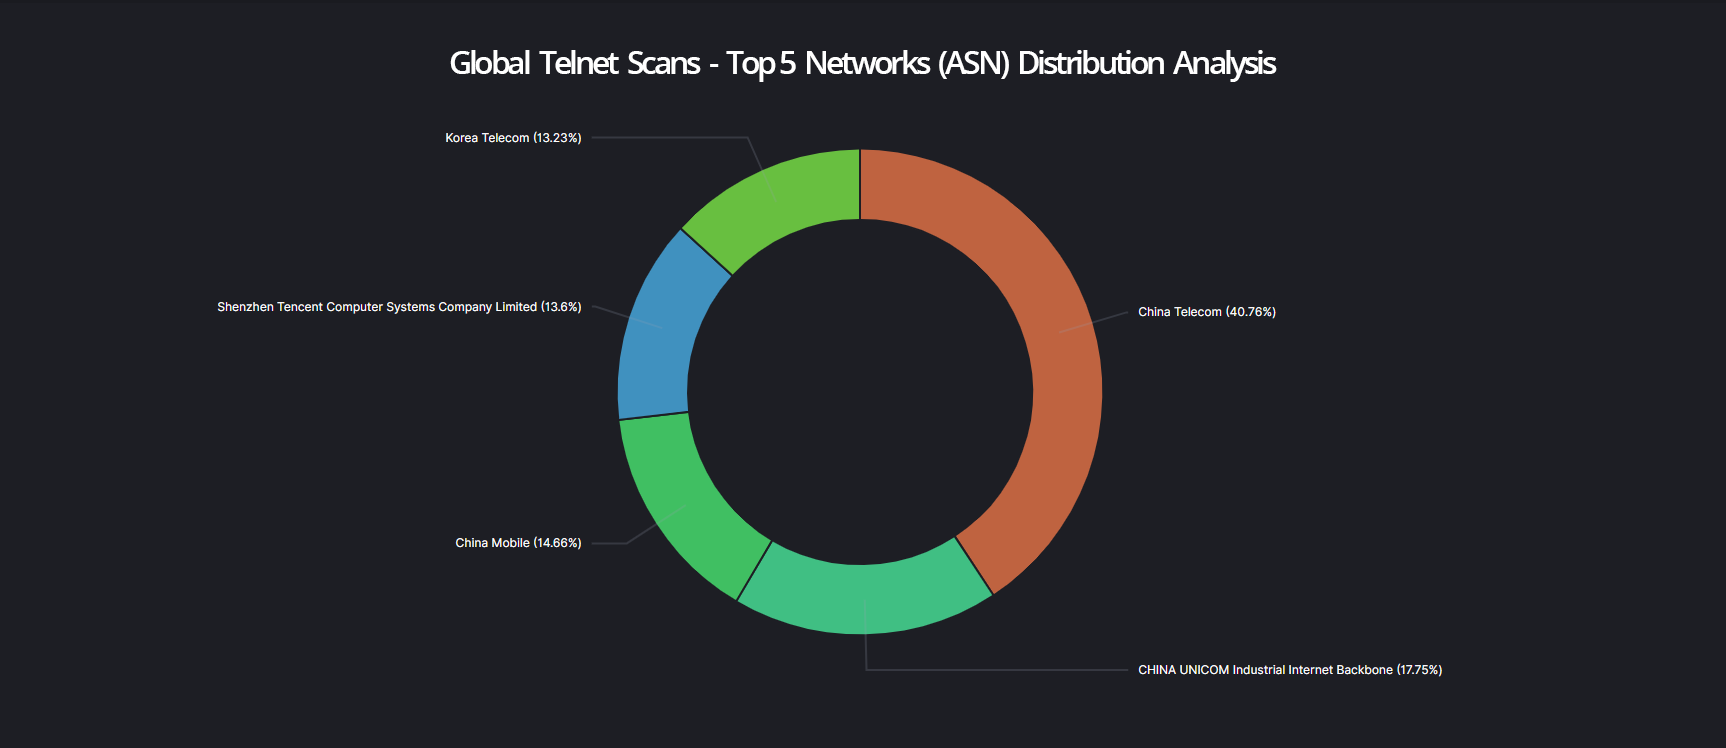
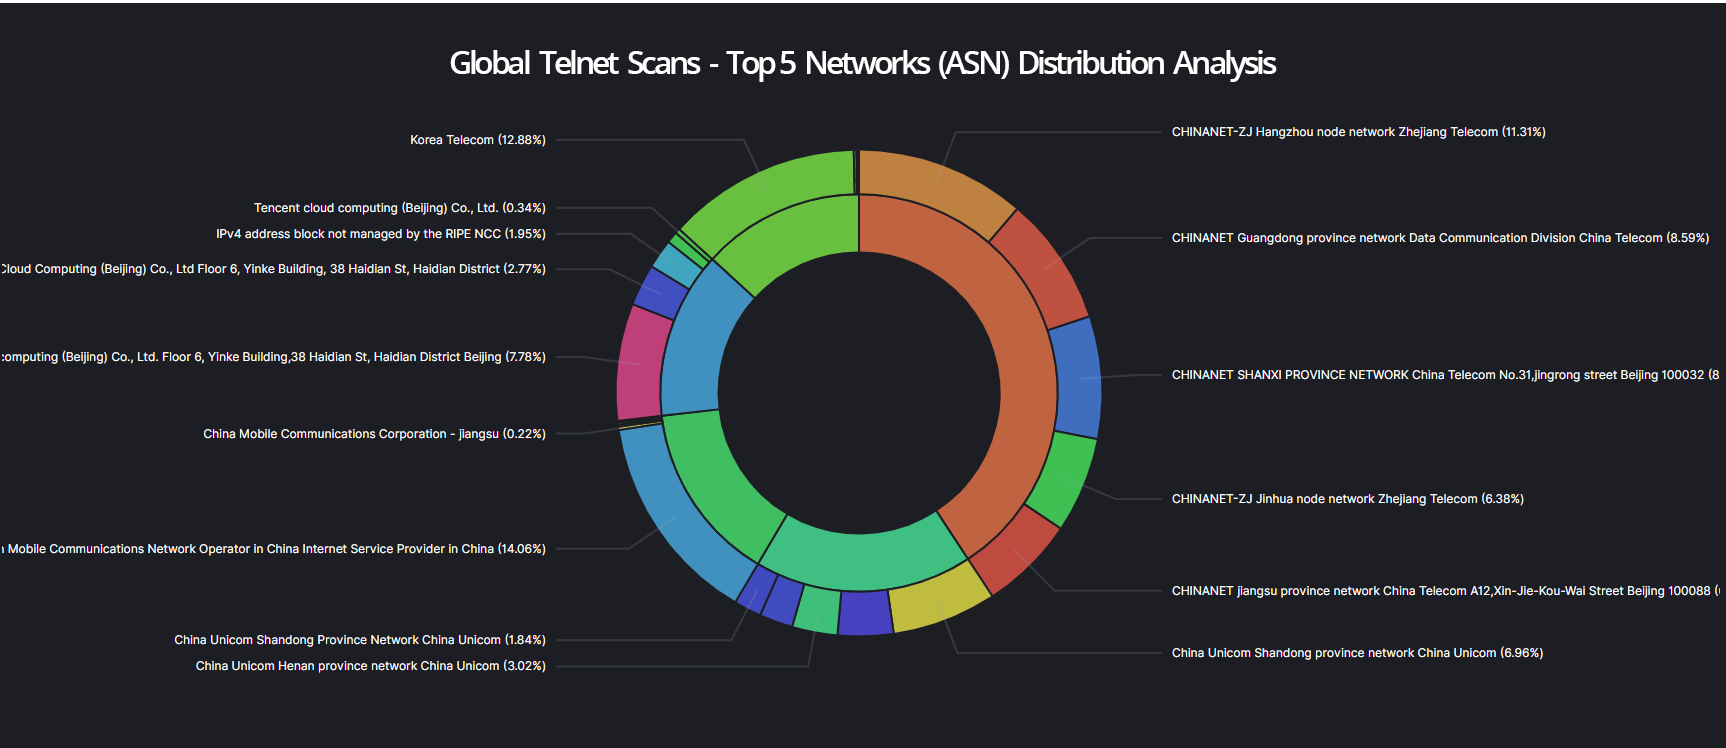
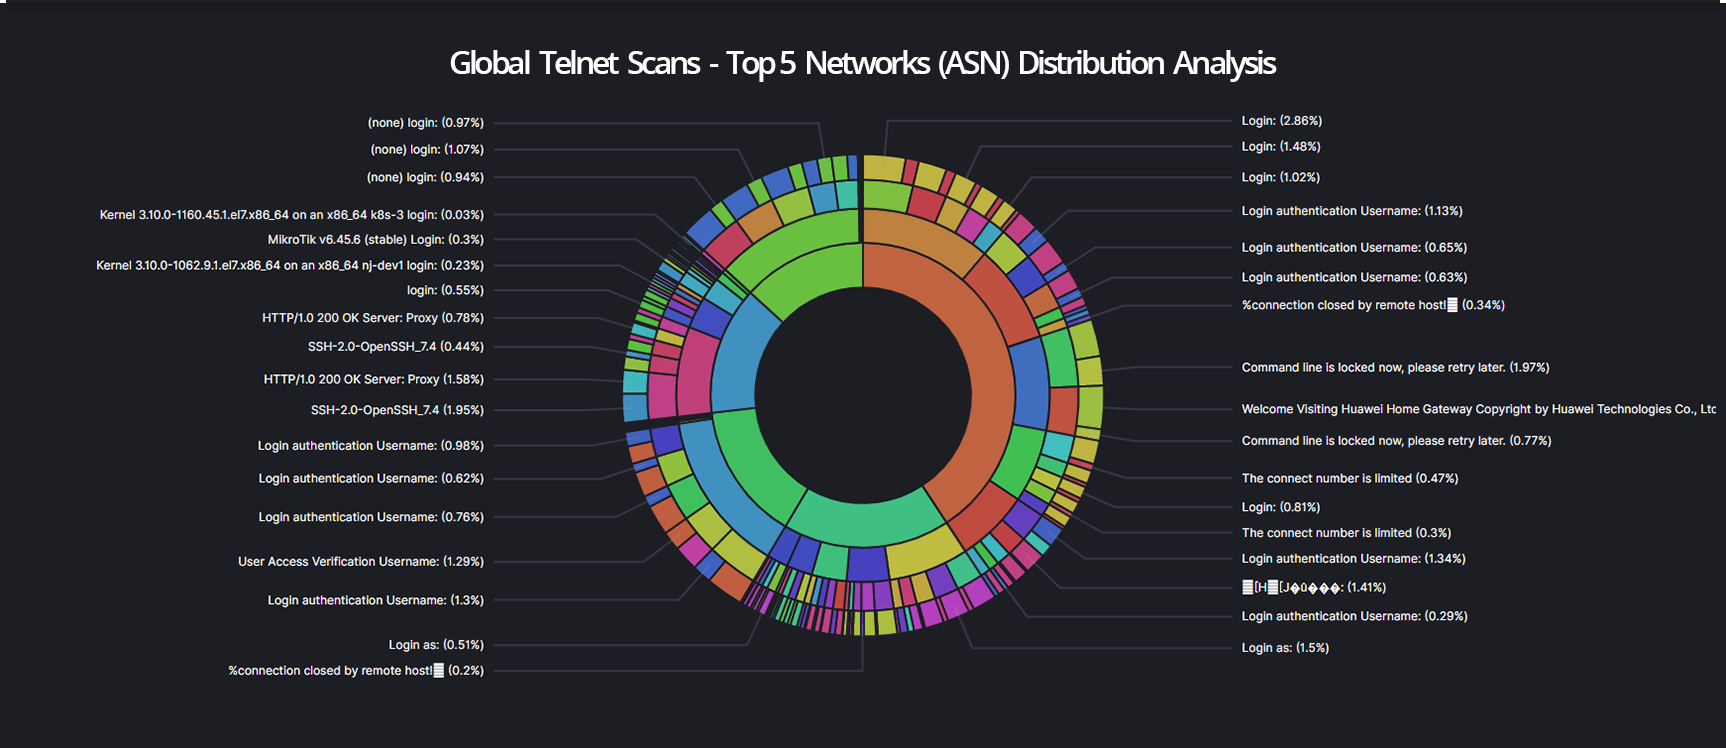
This example provides a quick overview of the distribution of Telenet services and associated network structures or information. These distribution analysis of various protocols or vulnerabilities can also be performed for specific countries, continents or even companies. This means that it is possible to perform fast global factual correlations and infrastructure analysis.
- The inner circle of the cyber radar shows the distribution of the identified Telnet services across the top 5 networks (autonomous systems) on the Internet.
- The second circle shows the distribution of the top 5 matching WhoIs description entries. These WhoIs descriptions often indicate the purpose or location of the identified asset.
- The third circle indicates which network prefixes belong to the previously displayed WhoIs descriptions.
- The fourth layer visualizes aggregation of the different telnet service banners.
Case Study
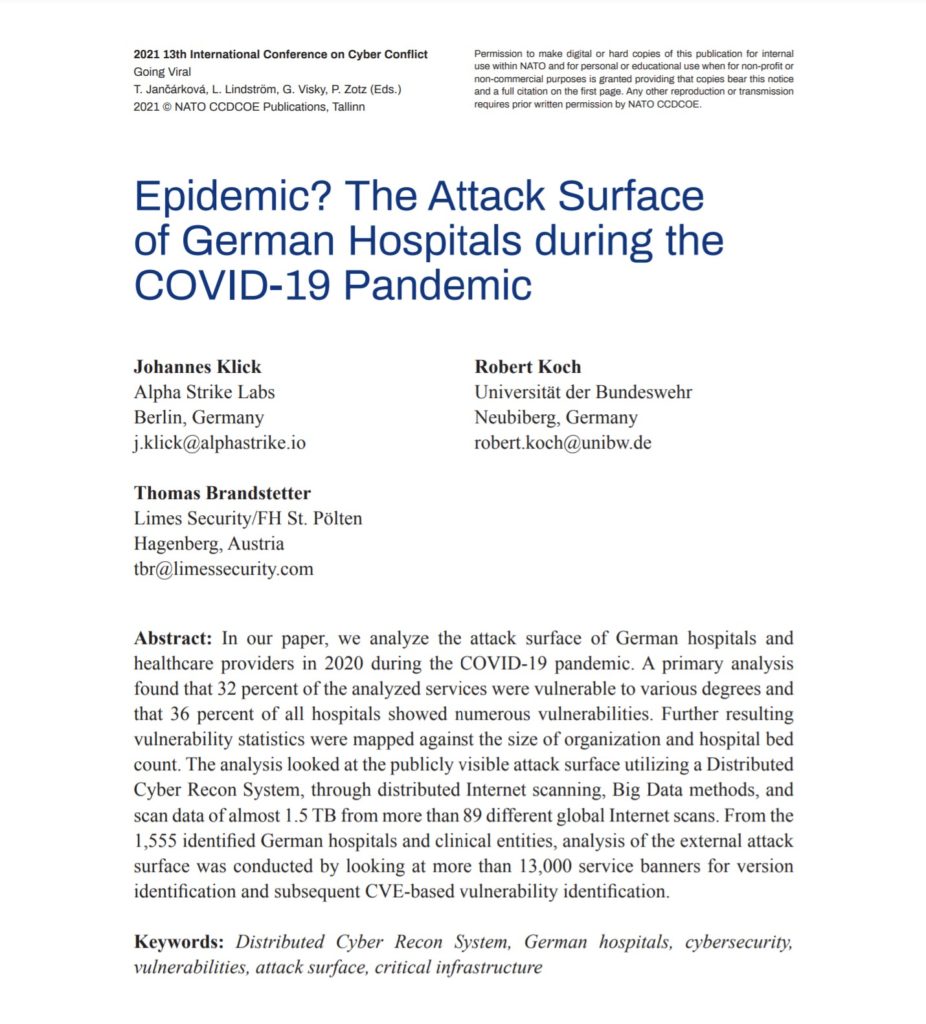
Epidemic? The Attack Surface of German Hospitals during the COVID-19 Pandemic
We analyzed the attack surface of German hospitals and healthcare providers in 2020 during the COVID-19 pandemic. The results of the study were presented at the NATO Cooperative Cyber Defence Centre of Excellence (CCDCOE) 13th International Conference on Cyber Conflict in May 2021.
The study shows that 32 percent of the services analyzed were vulnerable to varying degrees, and 36 percent of all hospitals examined had points of attack.