Cyber OSINT
”With our Cyber OSINT platform we can identify your real attack surface, eliminate shadow IT and uncover potential weak points of your company or your third party provider. Reduce your attack surface and improve security in a sustainable way.
What to expect
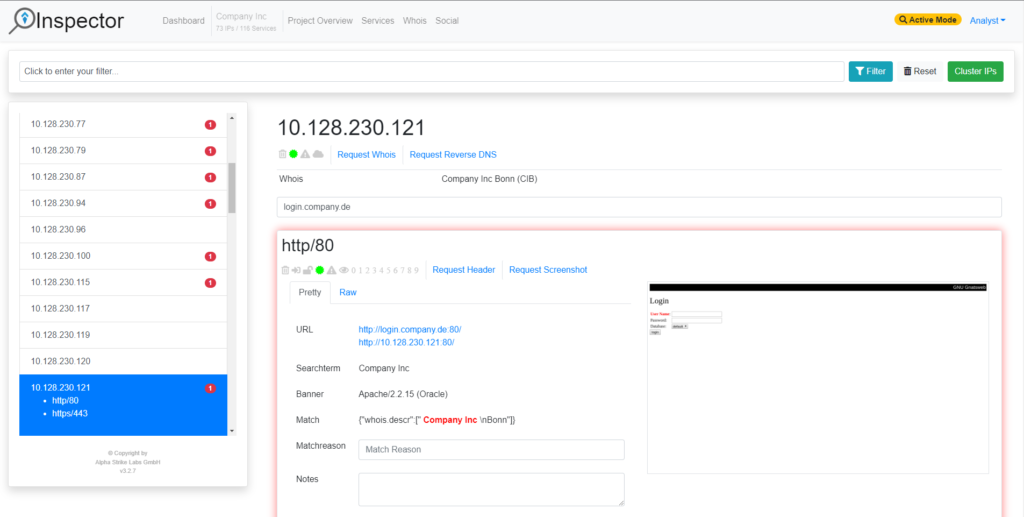
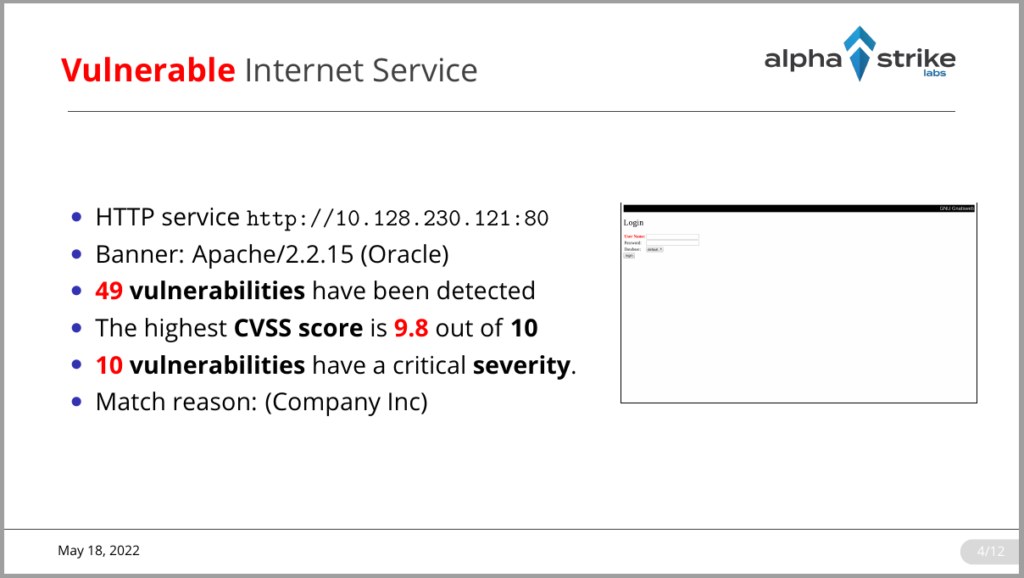
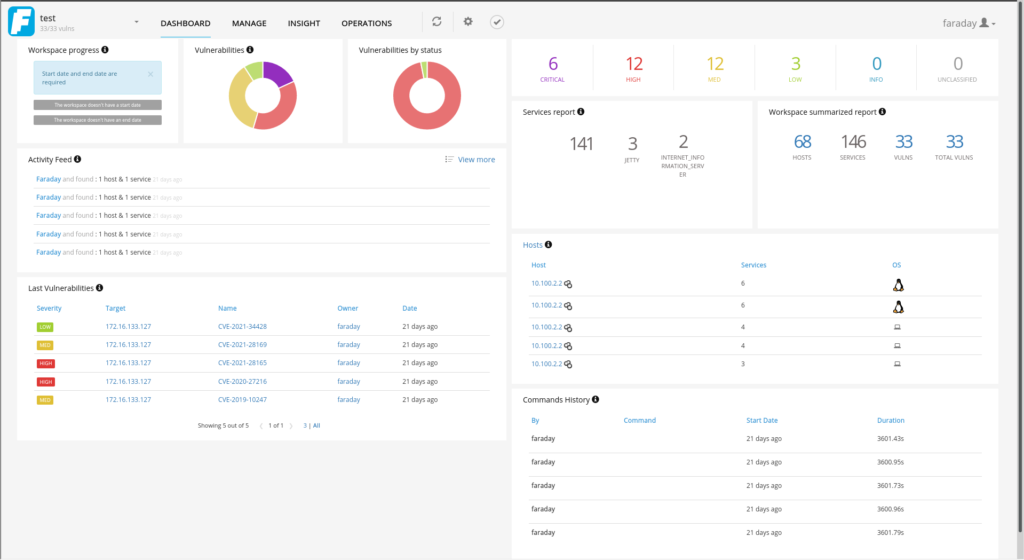
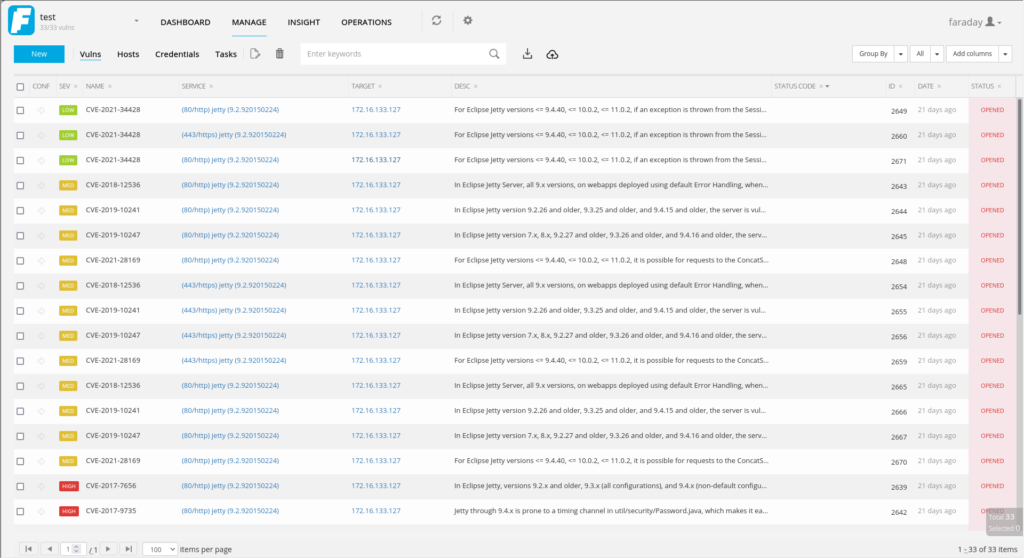
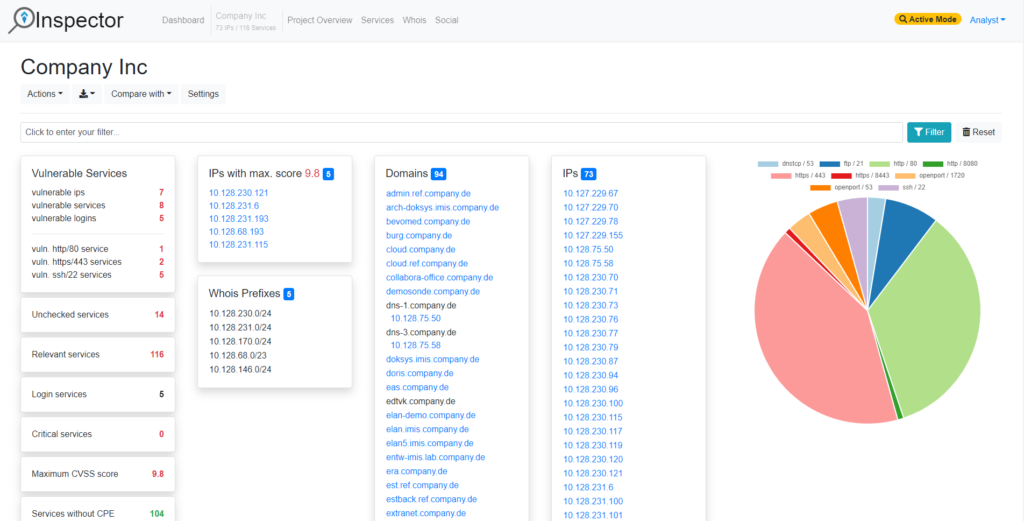
Our interactive Alpha Strike Labs Inspector provides the identified assets and can export the results in a variety of formats. The data can be exported to an Excel file with tables on hosts/services, domains, IP ranges and vulnerabilities, but also as slides for PDF or LateX. The data can be exported to Faraday and it can be accessed via API and Python Lib to transfer the assets into any application. Thus, the raw data can be stored in Splunk or Elastic.
KPIs
We generate key performance indicators (KPIs) that allow the comparison of different regions of a business units or plants. In this way, the development of individual business areas can be monitored in detail.
- Ongoing analysis allow comparisons over defined time periods
- Visualization of developments in individual regions or business segments possible
| Global | BU A | BU B | BU C | BU D | BU E | BU X | BU Z |
|---|---|---|---|---|---|---|---|
| Hosts: 3739 | 54% | 15% | 13% | 7% | 4% | 5% | 2% |
| Services: 15532 | 44% | 32% | 4% | 6% | 2% | 11% | 1% |
| Vulnerable Hosts: 7% (323) | 5% | 4% | 8% | 27% | 20% | 22% | 29% |
| Vulnerable Login Hosts: 5% (190) | 3% | 1% | 3% | 14% | 17% | 21% | 16% |
| Vulnerable Services: 3% (433) | 2% | 0,5% | 7% | 11% | 11% | 3% | 20% |
| Vulnerable Login Services: 1% (215) | 1% | 0,1% | 3% | 4% | 8% | 3% | 10% |

